
19% OF CHILDREN ACROSS NI STILL LIVING IN POVERTY
26 March 2026
By Becca Bor
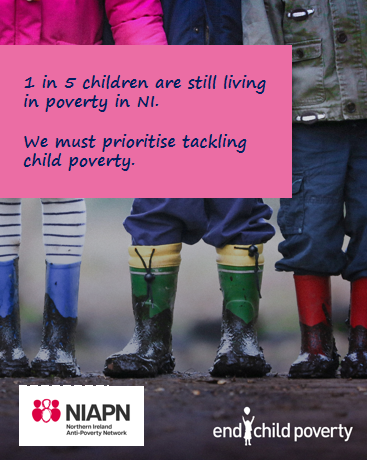
Today, for the first time, government has produced child poverty figures (after housing costs) for every constituency and local authority across the UK. The government figures show that child poverty rates are stubbornly high with 27% in the UK experiencing poverty, and with nearly 1 in 5 children living in poverty here in Northern Ireland.
The experience of poverty is not even across the North – it is an unacceptable 14% in Lisburn and Castlereagh Council, but rises to 23% of children in the Derry City and Strabane District Council area. Furthermore, 1 in 4 children in Belfast West and in Newry and Armagh are living in poverty.
The official poverty statistics look different this year because the UK government has changed their methodology. The UK child poverty statistics for 2024/2025 are based on self-reported household incomes through the Family Resource Survey, but this year, additional administrative information on what people have received through social security will also be added. This change was made due to income from social security being under-reported in the past. In practice, this will mean some lower-income families will have a higher income in the data than previously reported, meaning fewer families in poverty and some families in less deep poverty. However, this does not mean that suddenly people have more money in their pockets. The trends in poverty have not changed.
Government must do so much more to ensure that children are invested in. Every child deserves to grow up in a warm house, with access to good, nutritious food, and high quality services to support them to thrive. Families should not have to depend on food banks to feed their children, use baby banks so their children have the essentials they need like clothes or nappies, or live in cold or unsafe housing.
As this data is produced retrospectively, the impact of the UK government’s ‘Tackling Child Poverty Strategy’ can not be seen in these figures. Scrapping the two-child limit (due to come into effect on 6th April 2026) will see welcome reduction in child poverty. Furthermore, Stormont’s commitment to mitigating the benefit cap will further address the impacts of child poverty.
However, the child poverty rate is based upon household income and does not take into account the growing cost of living – aside from housing costs. These measurements do not reflect the reality of the high costs of energy, food, transport, childcare, schooling and leisure activities.
Moreover, these poverty statistics do not take into account the state of our public services – the long health waiting lists, including child mental health services; the lack of affordable, good quality, accessible childcare spaces; the lack of school places for children with special educational needs; the high cost of the school day and no universal provision of free school meals for any age group across the North; the infrastructure and regional inequalities between urban and rural areas and those in the West; and the incredibly high numbers of children registered as homeless, many of whom are living in temporary housing.
Becca Bor, Development Coordinator at the Northern Ireland Anti-Poverty Network, said:
“Government needs to continue to invest in households to reduce child poverty levels. Thanks to relentless campaigning by the Cliff Edge Coalition, and Child poverty organisations across NI and the UK, the two-child limit is finally going to be scrapped in April. And, here in the North, the benefit cap is mitigated, further protecting our children here.
But government must do more. This means strengthening Universal Credit to implement the ‘Essentials Guarantee’ so that at a minimum, UC reflects the cost of essentials, and providing more support to families with children, such as a child payment.
Stormont must immediately prioritise tackling Child Poverty. Too many children are struggling to survive, let alone thrive in our communities. The pressure on households is immense and relentless – too many parents are at breaking point. Our children’s welfare is our absolute priority, they need to be nurtured, supported and loved.”
The End Child Poverty Coalition and the Northern Ireland Anti Poverty Network urges the UK government and Stormont to continue investment to reduce child poverty levels.
The table below shows the rates of Child Poverty Across the eleven NI council areas:
| Local authority | Number | Percentage | ||
| 2023/24 | 2024/25 | 2023/24 | 2024/25 | |
| Belfast | 16193 | 14571 | 24.3% | 22.1% |
| Derry City and Strabane | 7628 | 7266 | 24.0% | 23.0% |
| Newry, Mourne and Down | 9552 | 8803 | 23.8% | 22.2% |
| Causeway Coast and Glens | 6293 | 6066 | 23.0% | 22.5% |
| Armagh City, Banbridge and Craigavon | 10678 | 10535 | 22.1% | 22.1% |
| Fermanagh and Omagh | 5218 | 5288 | 21.2% | 21.6% |
| Mid and East Antrim | 5406 | 5157 | 21.0% | 20.2% |
| Mid Ulster | 7008 | 6954 | 20.1% | 20.0% |
| Antrim and Newtownabbey | 5354 | 5036 | 18.4% | 17.5% |
| Ards and North Down | 5131 | 4921 | 17.5% | 16.9% |
| Lisburn and Castlereagh | 4440 | 4249 | 14.6% | 14.1% |
The table below shows the rates of Child Poverty Across the eighteen NI Parliamentary constituencies:
| Parliamentary constituency | Number | Percentage | ||
| 2023/24 | 2024/25 | 2023/24 | 2024/25 | |
| Belfast West | 6526 | 5771 | 28.5% | 25.4% |
| Belfast North | 5862 | 5206 | 26.6% | 23.9% |
| Newry and Armagh | 6591 | 6308 | 25.6% | 24.8% |
| Foyle | 5139 | 4855 | 24.7% | 23.4% |
| Upper Bann | 6243 | 5997 | 23.3% | 22.6% |
| East Londonderry | 4571 | 4396 | 23.0% | 22.4% |
| North Antrim | 4580 | 4374 | 22.4% | 21.7% |
| South Down | 5120 | 4838 | 21.9% | 21.0% |
| West Tyrone | 4598 | 4641 | 21.7% | 22.1% |
| Fermanagh and South Tyrone | 5168 | 5172 | 21.0% | 21.2% |
| Strangford | 3674 | 3543 | 20.1% | 19.5% |
| Mid Ulster | 4805 | 4734 | 19.9% | 19.7% |
| East Antrim | 3273 | 3118 | 18.9% | 18.2% |
| Belfast East | 3516 | 3379 | 18.3% | 17.8% |
| South Antrim | 3779 | 3583 | 17.2% | 16.6% |
| Belfast South and Mid Down | 3075 | 2887 | 16.0% | 15.1% |
| Lagan Valley | 3667 | 3503 | 15.9% | 15.2% |
| North Down | 2700 | 2569 | 15.5% | 15.0% |
Notes to editors:
- The full data set for the child poverty data can be found here: this is taken from the government’s HBAI data
- The End Child Poverty Coalition is made up of 140 organisations including the Northern Ireland Anti-Poverty Network, child welfare groups, social justice groups, faith groups, trade unions and others. Together with a group of Youth Ambassadors, members campaign for a UK free of child poverty. Further information on the Coalition can be found here; https://endchildpoverty.org.uk/about/
- This data uses a Relative After Housing Costs measure of child poverty. ‘After Housing Costs’ shows the income available to a household once rent, water rates, mortgage interest payments, buildings insurance payments, ground rent and service charges are paid. This enables a more accurate comparison of what households have available to spend on food, utilities, clothing and leisure, than looking at income alone, given the disparity of rents in different parts of the UK